Visualize DAG with pyvis
26 Mar 2023In previous post Visualize DAG with Graphviz, I talked about how to use Graphviz to display DAG. Graphviz is greate but it can only generate pictures in svg. For nodes with large amount of data, it will be hard to show all the data in a single picture.
With today’s javascript, it will be nice to show and hide node infomation dynamically. Rowland has created a internal repo called gexplorer, which runs on a flask server with vis.js on the front end. The problem with this implementation is that it is hard to share the data. The other people has to have access to your server, or have to spin up his own server. Or he can only receive screenshot of the picture. I think it would be nice if we have this kinda of dynamic implementation with jupyterlab.
Last Friday(03/24/2023), a colleage Tzintzuni Garcia from bio team of GDC, did a presentation about his attempt. He used bokeh to build the visulaizaiton. Network is shown in the example pictures of bokeh but I could not find good tutorial about how to build network with bokeh on its offical website. I think network is not one of their main focus. And in the presentation, the library is not hendling hierarchy for DAG very well.
Recently I found a python library called pyvis. Which also use vis.js. vis.js is a
A dynamic, browser based visualization library. The library is designed to be easy to use, to handle large amounts of dynamic data, and to enable manipulation of and interaction with the data. The library consists of the components DataSet, Timeline, Network, Graph2d and Graph3d.
It has rich implementation for networks. Pyvis is mainly the python wrapper for the network part of vis.js.
Examples from yaml file
Examples
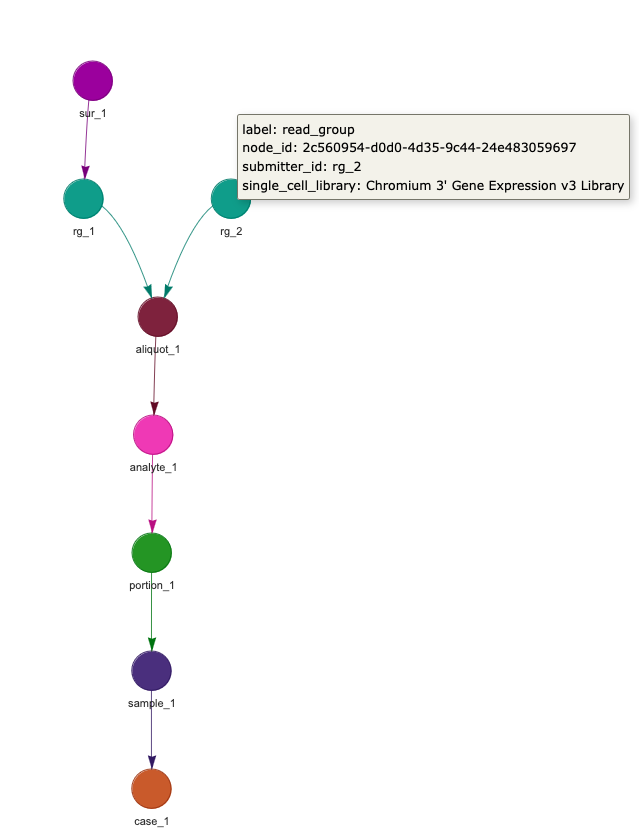
The examples from previous psot Visualize DAG with Graphviz will look like the following:
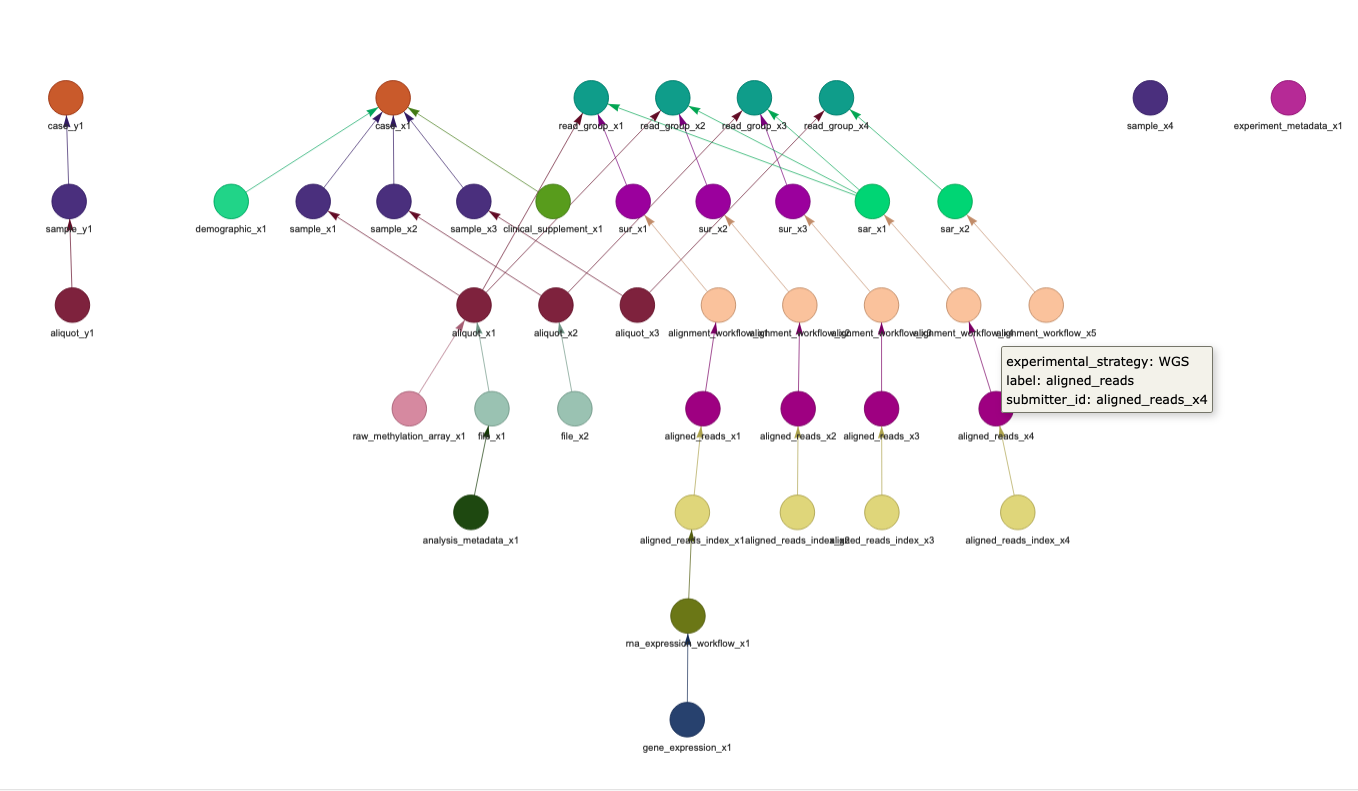
The gdc samples from the previous post will look like:
Code
Here is the code for this visualization with pyvis:
import json
import os
import uuid
from functools import lru_cache
from typing import Dict, List

import requests
import yaml
from graphviz import Digraph

from pyvis.network import Network

from IPython.core.display import display, HTML


def draw(nodes: List[Dict[str, str]], edges: List[Dict[str, str]], reverse=False):

    got_net = Network(
        notebook=True,
        cdn_resources='in_line',
        layout=True,
        directed=True,
        height='1111px',
        width='90%'
    )

    node_id_to_submitter_id = {}
    for node in nodes:
        submitter_id = node.get("submitter_id")
        node_id = node.get("node_id")
        suffix = f":{node['gencode_version']}" if node.get("gencode_version") else ''

        if submitter_id and node_id:
            node_id_to_submitter_id[node_id] = submitter_id + suffix
        elif submitter_id:
            node_id_to_submitter_id[submitter_id] = submitter_id + suffix
        else:
            node_id_to_submitter_id[node_id] = node_id + suffix

    print(node_id_to_submitter_id)

    for node in nodes:
        n_id = node_id_to_submitter_id.get(
            node.get("node_id") or node.get("submitter_id")
        )
        # print(n_id, node.get("submitter_id"), node.get("node_id"))
        got_net.add_node(
            n_id,
            n_id,
            title='\n'.join(f"{k}: {v}" for k, v in node.items()),
            color=get_color(node.get('label'))
        )


    for edge in edges:
        src = node_id_to_submitter_id.get(edge["src"]) or edge["src"]
        dst = node_id_to_submitter_id.get(edge["dst"]) or edge["dst"]
        # print(src, dst, edge['src'], edge['dst'])
        try:
            if reverse:
                got_net.add_edge(dst, src)
            else:
                got_net.add_edge(src, dst)
        except AssertionError:
            continue

    neighbor_map = got_net.get_adj_list()

    got_net.show_buttons()
    options = got_net.options.to_json()
    options = options.replace("hubsize", "directed")
    got_net.set_options(options)
    got_net.show("graph.html")
    return display(HTML("graph.html"))


def draw_yaml(yaml_raw: str):
    try:
        yaml_dict = yaml.load(yaml_raw, Loader=yaml.FullLoader)
    except yaml.scanner.ScannerError:
        yaml_dict = json.loads(yaml_raw)

    return draw(yaml_dict['nodes'], yaml_dict['edges'])


def draw_url(url: str):
    response = requests.get(url)
    print(response.status_code)
    return draw_yaml(response.content)


@lru_cache(maxsize=256)
def get_color(label: str) -> str:
    label = str(uuid.uuid5(UUID_NAMESPACE, label))
    label_color = hex(int("".join(map(str, map(ord, label)))) & 0x00FFFFFF)
    return "#{:f<6}".format(label_color[2:])


UUID_NAMESPACE_SEED = os.getenv("UUID_NAMESPACE_SEED", "f0d2633b-cd8b-45ca-ae86-1d5c759ba0d1")
UUID_NAMESPACE = uuid.UUID("urn:uuid:{}".format(UUID_NAMESPACE_SEED), version=4)
A few things to metion about this code.
- As you might notice, I used the same color algorithm written by Rowland.
layout=True, directed=Trueare needed for a good hierarchical layout. Those are not set by default.display(HTML("graph.html"))is needed for google colab to display the chart. It is not neccessary if you are using jupyterlab etc.options = options.replace("hubsize", "directed")will replace thesubMethodof hierarchical of layout fromhubsizetodirected, which works better for our DAG. I thinkhubsizemight be more suitable for Undireacted Graph.- The Algorithm from Graphviz is better than vis.js. Our DAG in vis.js sometimes have edges crossing each other. Then you have to manually draw the nodes around to seperate them.
Examples for our live data
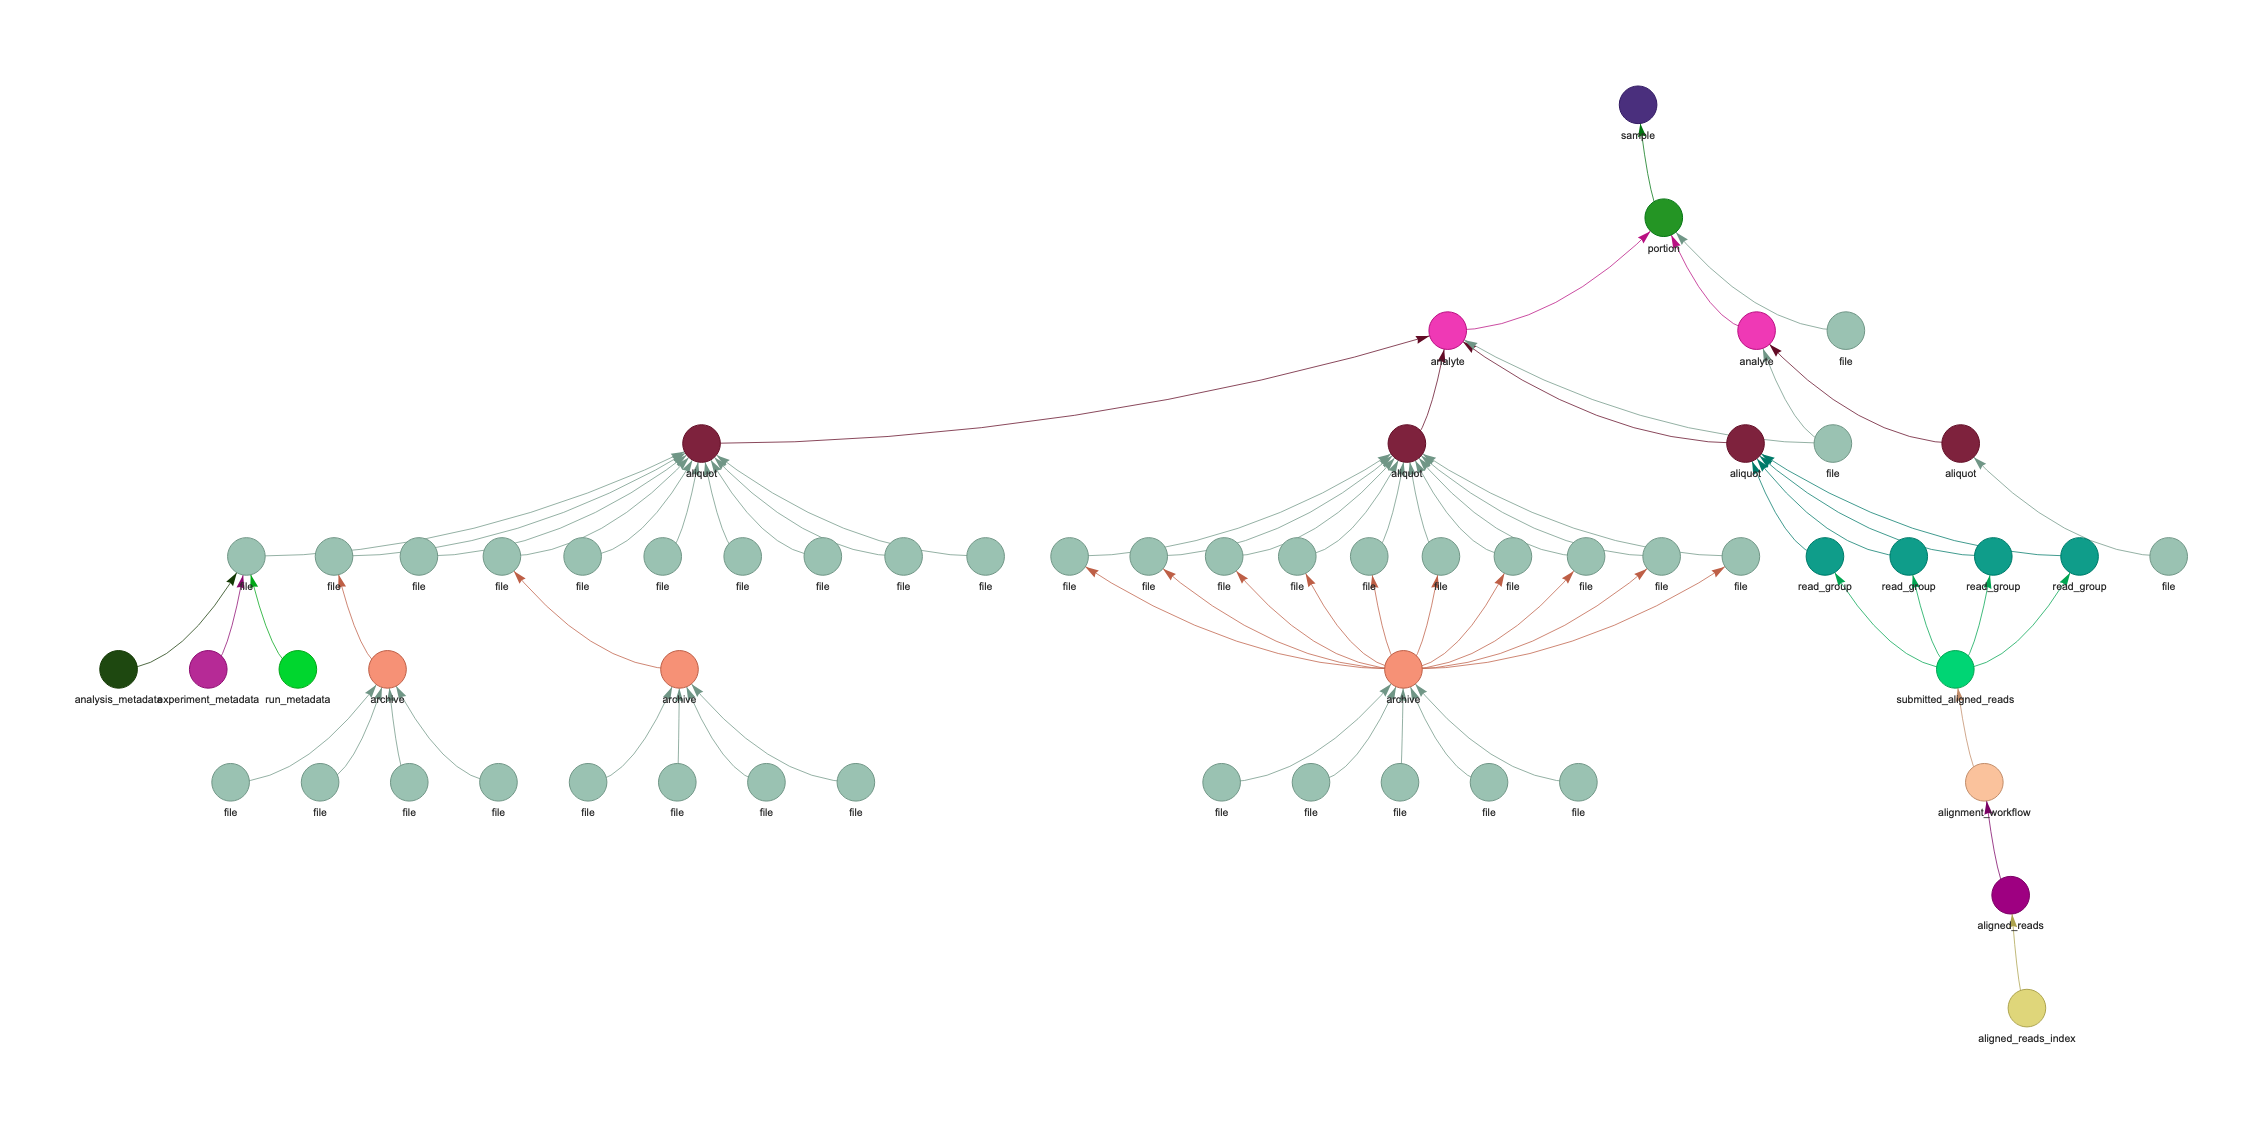
Examle
The code is run in our jupyterlab server, which will fetch out the data from our postgres database. Due to the size of the data, I have limited the max_depth and max_width to 10.
Code
The following is the code for the live data:
from collections import deque


@lru_cache(maxsize=256)
def get_color(label: str) -> str:
    label = str(uuid.uuid5(UUID_NAMESPACE, label))
    label_color = hex(int("".join(map(str, map(ord, label)))) & 0x00FFFFFF)
    return "#{:f<6}".format(label_color[2:])


UUID_NAMESPACE_SEED = os.getenv("UUID_NAMESPACE_SEED", "f0d2633b-cd8b-45ca-ae86-1d5c759ba0d1")
UUID_NAMESPACE = uuid.UUID("urn:uuid:{}".format(UUID_NAMESPACE_SEED), version=4)


def draw_subtree(node_id, max_depth=5, max_width=float('inf'), show_buttons=False):

    got_net = Network(notebook=True, cdn_resources='in_line', layout=True, directed=True, height='1500px')

    edge_pointer = 'in'

    with g.session_scope() as s:
        root = g.nodes().get(node_id)

        marked = set()
        queue = deque([(root, 0)])


        marked.add(root.node_id)
        got_net.add_node(
            root.node_id,
            label=root.label,
            title=f'{root.label} {root.node_id}\n' + '\n'.join(f"{k}: {v}" for k, v in root.props.items()),
            level=0,
            color=get_color(root.label)
        )


        while queue:
            current, depth = queue.popleft()


            if depth + 1 > max_depth:
                continue

            edges = current.edges_out if edge_pointer == "out" else current.edges_in
            for i, edge in enumerate(edges, 1):

                n = edge.dst if edge_pointer == "out" else edge.src

                if n.node_id not in marked:
                    queue.append((n, depth + 1))
                    marked.add(n.node_id)
                    got_net.add_node(
                        n.node_id,
                        label=n.label,
                        title=f'{n.label} {n.node_id}\n' + '\n'.join(f"{k}: {v}" for k, v in n.props.items()),
                        level=depth+1,
                        color=get_color(n.label)
                    )


                got_net.add_edge(edge.src.node_id, edge.dst.node_id)

                if i >= max_width:
                    break


    neighbor_map = got_net.get_adj_list()

    if show_buttons:
        got_net.show_buttons()
    return got_net.show("gameofthrones.html")
The thing to notice about this code is that, to get good hierarchical layout, I rewrte the bsf method in our psqlgraph repo and set the level property for each node. This was before I figure out the hierarchical sortMethod property. But I kept this implementation so I can set the max_width for my graph.