nmrglue
09 Apr 2023nmrglue is a python module to work with nmr data. It supports multiple nmr formats including bruker, varian, sparky, etc. The complete list is in the document.
In this post, I will show how to use nmrglue to process and visualize 2D ucsf(sparky) NMR data.
How to use nmrglue
Installation
The nmrglue can be easily installed with pip:
pip install nmrglue
Read Sparky data
Now we can import and use nmrglue:
import nmrglue as ng

hsqc_dic, hsqc_data = ng.sparky.read('/path/to/data/c13hsqc.ucsf')
Show headers
The headers are now loaded into a dictionary:
for k, v in hsqc_dic.items():
  print(k, v)
Outputs:
ident UCSF NMR
naxis 2
ncomponents 1
encoding 0
version 2
owner asurin
date Mon Apr 03 11:32:34 2023
comment
seek_pos 4194740
scratch
w1 {'nucleus': '13C', 'spectral_shift': 0, 'npoints': 1024, 'size': 1024, 'bsize': 128, 'spectrometer_freq': 125.77224731445312, 'spectral_width': 20752.421875, 'xmtr_freq': 75.00618743896484, 'zero_order': 0.0, 'first_order': 0.0, 'first_pt_scale': 0.0, 'extended': b'\x80\x00\x00\x00\x00\x00\x00\x00\x00\x00\x00\x00\x00\x00\x00\x00\x00\x00\x00\x00\x00\x00\x00\x00\x00\x00\x00\x00\x00\x00\x00\x00\x00\x00\x00\x00\x00\x00\x00\x00\x00\x00\x00\x00\x00\x00\x00\x00\x00\x00\x00\x00\x00\x00\x00\x00\x00\x00\x00\x00\x00\x00\x00\x00\x00\x00\x00\x00\x00\x00\x00\x00\x00\x00\x00\x00\x00\x00\x00\x00\x00\x00\x00\x00'}
w2 {'nucleus': '1H', 'spectral_shift': 0, 'npoints': 1024, 'size': 1024, 'bsize': 128, 'spectrometer_freq': 500.1524963378906, 'spectral_width': 7142.85693359375, 'xmtr_freq': 5.000030517578125, 'zero_order': 0.0, 'first_order': 0.0, 'first_pt_scale': 0.0, 'extended': b'\x80\x00\x00\x00\x00\x00\x00\x00\x00\x00\x00\x00\x00\x00\x00\x00\x00\x00\x00\x00\x00\x00\x00\x00\x00\x00\x00\x00\x00\x00\x00\x00\x00\x00\x00\x00\x00\x00\x00\x00\x00\x00\x00\x00\x00\x00\x00\x00\x00\x00\x00\x00\x00\x00\x00\x00\x00\x00\x00\x00\x00\x00\x00\x00\x00\x00\x00\x00\x00\x00\x00\x00\x00\x00\x00\x00\x00\x00\x00\x00\x00\x00\x00\x00'}
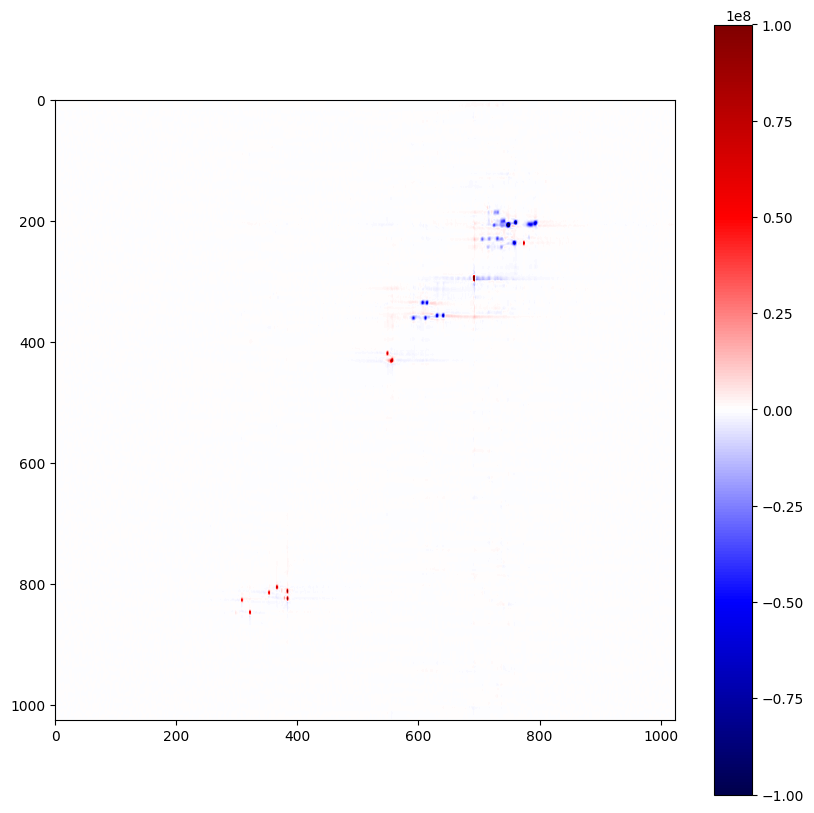
I have loaded a hsqc 2D spectrum and w1 and w2 are axis headers for carbon 13 and proton.
Visualization
hsqc_data = hsqc_data[::-1]
plt.figure(figsize=(10,10))
plt.imshow(hsqc_data, cmap='seismic', vmin=-1e8, vmax=1e8)
plt.colorbar()
Convert nmr csv to ucsf with nmrglue
MestReNova is a popular software to visualize and process NMR Spectrum. It has good algorithm to process 2D NMR spectrum, better than even the TopSpin and Vnmrj software. I have tried to manually process a COSY spectrum in vnmrj but could not get it to be as good as the same spectrum processed by my colleague using MestReNova. But when trying to analyze 2D spectrum, I could not find the overlay function for 2D spectrum in MestReNova. To analyze 2D NMR spectrum, I like to use Sparky. But there is no direct way to convert the output of MestReNova to ucsf format for Sparky.
After some research about the ucsf format, I decided to generate NMR csv format from MestReNova, and then use nmrglue to convert the csv format to ucsf format. For the file header and axis headers, I decided to generate ucsf directly from bruker/varian files and then update and use the headers.
So I have one ucsf file with bad data named noesy_varian.ucsf and csv file with good data but no headers called nosey.csv. Then I used the following code to do the conversion:
import matplotlib.pyplot as plt
import nmrglue as ng

noesy_csv = pandas.read_csv('/path/to/noesy.csv', sep="\t", header=0,index_col=0)
noesy_csv = noesy_csv.iloc[: , :-1]                 # Drop empty column

# horizontal and vertical flip matrix to match expected format
noesy_csv = noesy_csv[noesy_csv.columns[::-1]]
noesy_csv_data = noesy_csv.to_numpy()
noesy_csv_data = noesy_csv_data[::-1]
noesy_csv_data.shape

noesy_varian_dic, noesy_varian_data = ng.sparky.read('/path/to/noesy_varian.ucsf')

# original ucsf data has 1024 data points in each axis and the csv file has 2048 data points
noesy_varian_dic['w1']['npoints'] = 2048
noesy_varian_dic['w1']['size'] = 2048
noesy_varian_dic['w1']['bsize'] = 256
noesy_varian_dic['w2']['npoints'] = 2048
noesy_varian_dic['w2']['size'] = 2048
noesy_varian_dic['w2']['bsize'] = 256

ng.sparky.write('/path/to/noesy_csv.ucsf', noesy_varian_dic, noesy_csv_data, overwrite=True)

noesy_csv_dic, noesy_csv_data_read = ng.sparky.read('/path/to/noesy_csv.ucsf')

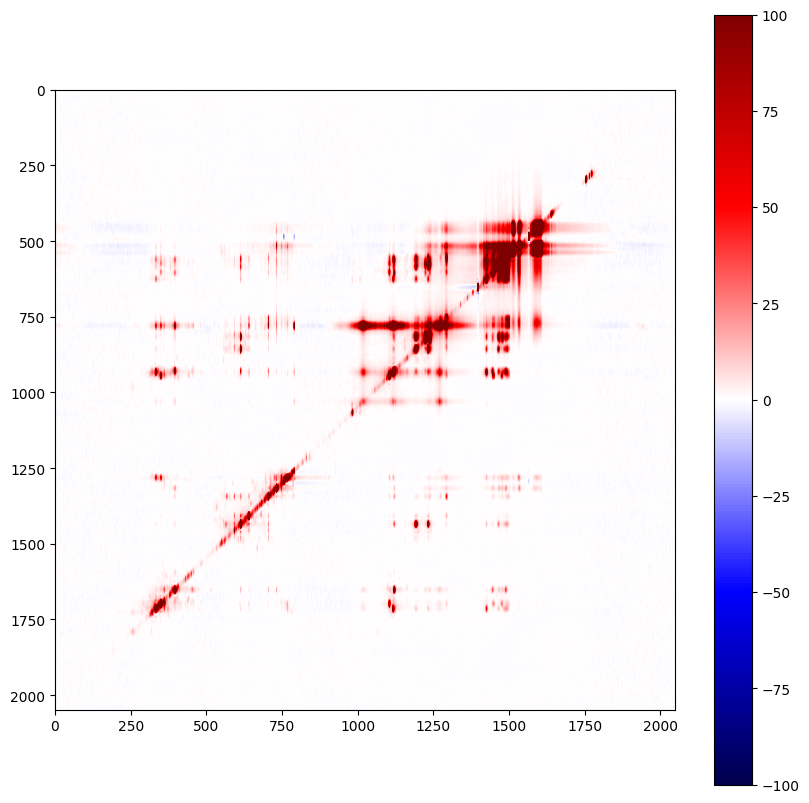
plt.figure(figsize=(10,10))
plt.imshow(noesy_csv_data_read[::-1], cmap='seismic', vmin=-100, vmax=100)
plt.colorbar()
The output image looks like this:

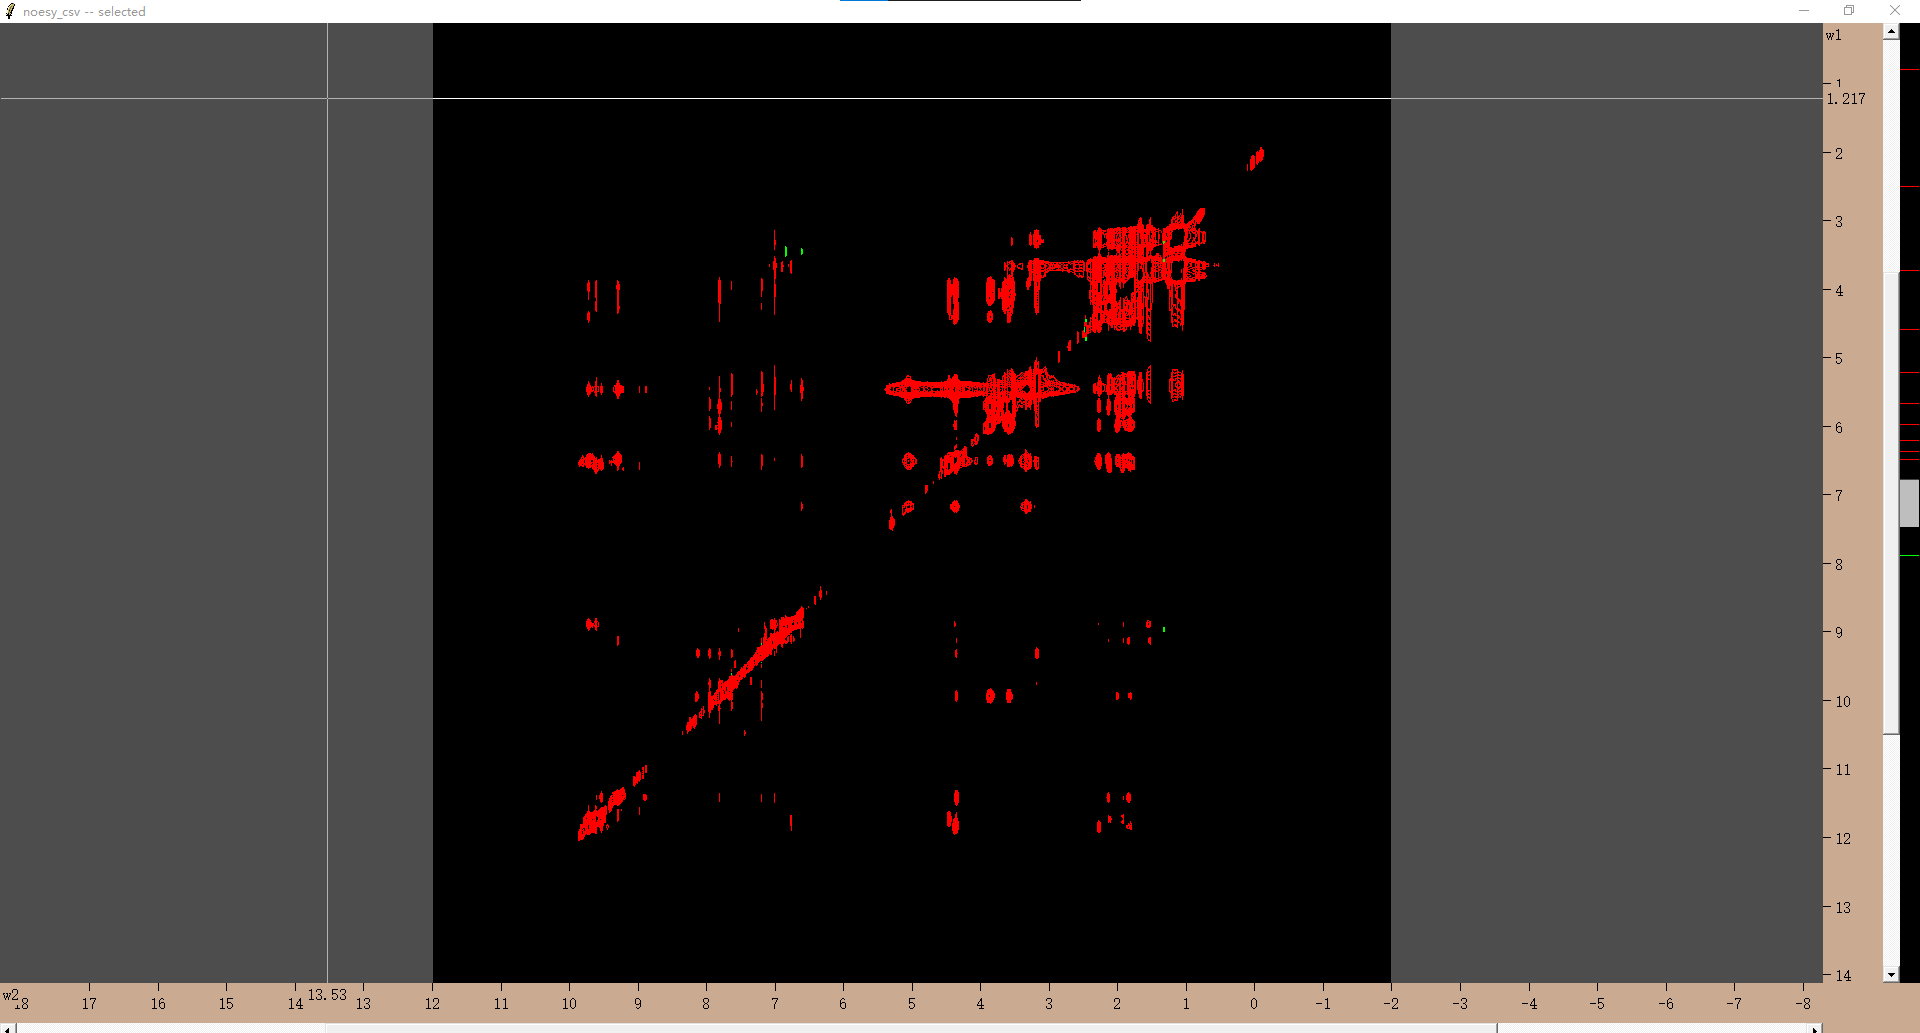
The generated ucsf file was read by Sparky successfully:
